🔗The Motivation
Whenever I ran into a bug in past, my trusty friend console.log was always there for me. Make a change, save the code, check the console - that was my entire debugging process. Simple, right?
Then something amazing happened - I discovered the debugger in VSCode and Chrome DevTools. Mind. Blown. 🤯 Instead of littering my code with logs, I could set breakpoints, step through the code, and watch variables in real time. It was like upgrading from a bicycle to a sports car!
But here’s the thing - that only worked for local issues. When something breaks in production, you can’t just open DevTools and step through the server code (wouldn’t that be nice though?). That’s when the real question hit me - how do we know what’s happening in production?
🔗Learning the Hard Way
I thought I was clever when I figured out I could write logs to a file using node server.js > logs.txt. Problem solved! Or so I thought… What I didn’t realize (and what you might be wondering too) was that in production, there isn’t just one server - there could be dozens! Each with its own logs.txt file. Not so simple anymore, huh?
This is exactly why having a mentor or experienced team members is so valuable. Sure, we can figure things out on our own, but sometimes a gentle nudge in the right direction saves us weeks of headaches!
Let’s dive into the world of logging.
🔗What do logs look like?
Logs often include more than just a message — things like timestamps, trace IDs, and the data you want to capture. Here’s an example of how a few log entries might look:
{ timestamp: '2025-05-27T10:15:23.123Z', traceId: 'abc123', level: 'debug', message: 'Fetching products' }
{ timestamp: '2025-05-27T10:15:23.456Z', traceId: 'abc123', level: 'trace', message: 'Products fetched successfully', data: [{ id: 1, name: 'Coffee Mug' }, { id: 2, name: 'Notebook' }] }
{ timestamp: '2025-05-27T10:15:24.789Z', traceId: 'xyz789', level: 'error', message: 'Error fetching products', error: 'Database timeout' }
- timestamp: The exact moment when the log was recorded, down to the millisecond
- traceId: A unique identifier that helps track a request
- level: Indicates how important the log is - from debug to error
- message: The main log content explaining what happened
- data/error: Additional context or error details that help tell the full story
🔗Loggers in the ecosystem
There are many popular logging libraries in the Node.js ecosystem like Winston, Bunyan, and Pino. But what problems do they actually solve? Here are the key features that make a logger production-ready:
- Log level control - Ability to filter logs based on severity (debug, info, warn, error)
- Pretty printing - Human-readable formatting in development, JSON in production
- Contextual logging - Adding metadata like request IDs and user info to every log
- Distributed tracing - Tracking requests across multiple services
- Data sanitization - Automatically removing sensitive information like passwords and tokens
- Observability integration - Working seamlessly with monitoring and tracing tools
Let’s look at a real-world example. Say you have an e-commerce application with a products service. Here’s how the logging might look in practice:
const logger = require('logger');

class ProductsController {
    constructor(private readonly productsService: ProductsService) {}

    async getProducts() {
        try {
            logger.info('Fetching products');
            const products = await this.productsService.getProducts();
            logger.info('Products fetched successfully', { products });
            return products;
        } catch (error) {
            logger.error('Error fetching products', { error });
            throw error;
        }
    }

    async createProduct(product: Product) {
        try {
            logger.info('Creating product', { product });
            const newProduct = await this.productsService.createProduct(product);
            logger.info('Product created successfully', { newProduct });
            return newProduct;
        } catch (error) {
            logger.error('Error creating product', { error });
            throw error;
        }
    }
}
🔗Controlling Log Output
When implementing logging in our application, we need to consider the volume and content of logs carefully. Let’s analyze the code above - for each request, we log:
- The start of the operation
- The successful result
- Any errors that occur
At a scale of 1,000 requests per second, this generates 3,000 log entries per second. But do we need this level of detail in all environments?
In development, detailed logging helps with debugging and understanding the application flow. However, in production, excessive logging can cause issues:
- Performance Impact: High-volume logging adds latency to request processing
- Cost Considerations: Log storage and search capabilities come with significant costs in terms of storage and bandwidth
To manage log output effectively, we can control the logging level:
logger.level = 'info';
This means only logs at the info level and above will be shown. So debug and trace logs will be ignored.
🔗How Log Levels Work
Most logging systems (like Winston, Pino, etc.) use a standard set of log levels, ordered by importance:
- trace - super-detailed logs, often used to track every step of a function or process. These are mostly useful when debugging tricky issues.
- debug - helpful for debugging, but less noisy than trace.
- info - general messages about what the app is doing (e.g., “Server started”, “User logged in”).
- warn - something unexpected happened, but the app can still keep running.
- error - something went wrong and needs attention.
When you set a log level (e.g., info), you’ll see only the logs at that level and any more severe ones (warn and error). Everything below (debug, trace) gets filtered out.
So, when adding logs, ask yourself:
- Should this always be shown? → use info
- Is it only for debugging? → use debug or trace
- Is this a warning or an actual error? → use warn or error
This way, you can avoid log spam and keep the important information visible.
🔗Using different log levels for better control
const logger = require('logger');

class ProductsController {
    constructor(private readonly productsService: ProductsService) {}

    async getProducts() {
        try {
            logger.debug('Fetching products');
            const products = await this.productsService.getProducts();
            logger.trace('Products fetched successfully', { products });
            return products;
        } catch (error) {
            logger.error('Error fetching products', { error });
            throw error;
        }
    }

    async createProduct(product: Product) {
        try {
            logger.debug('Creating product', { product });
            const newProduct = await this.productsService.createProduct(product);
            logger.trace('Product created successfully', { newProduct });
            return newProduct;
        } catch (error) {
            logger.error('Error creating product', { error });
            throw error;
        }
    }
}
If we set:
logger.level = 'debug';
This means we’ll see:
- The start of the operation (debug level)
- Any errors that occur (error level)
But we won’t see the successful results (trace level) since they’re below debug in priority.
In development, we typically set the level to trace to see everything. In production, we keep it at info or error to focus on what matters most.
🔗Pretty printing the logs in local environment
When we develop locally, we don’t want to see the logs in a raw format. We want to see them in a pretty format. pino-pretty is a good library which does exactly that.
From the official documentation:
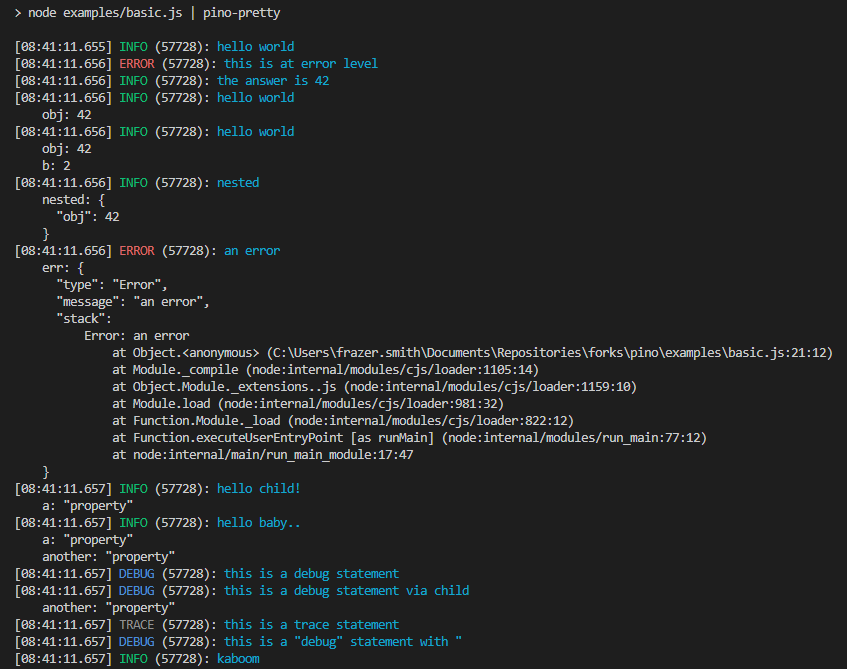
Its way readable and easier to understand than the raw logs.
🔗Adding context to the logs
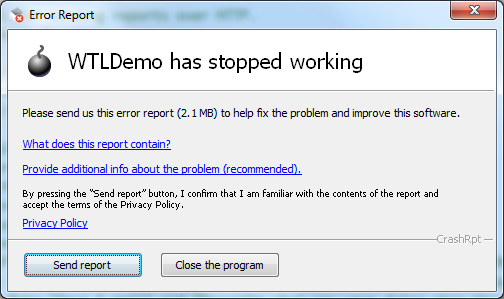
Let’s say a user tries to check out a product and it fails. We want to know why. Usually, there will be a “Report Issue” button in the UI when something like this happens. When clicked, this button sends a request to the backend with the details of the error.
The important detail here is the traceId. It is a unique identifier for the request.
We add a unique traceId for each HTTP request. So when you need to debug an issue and open your logs—whether in Elasticsearch, CloudWatch, Datadog, or any other logging system—you can easily find all the relevant logs for that service.
{ timestamp: '2025-05-27T10:15:20.001Z', traceId: 'abc123', level: 'info', message: 'Received request for /products' }
{ timestamp: '2025-05-27T10:15:20.789Z', traceId: 'def456', level: 'debug', message: 'Authenticating user' }
{ timestamp: '2025-05-27T10:15:21.150Z', traceId: 'ghi789', level: 'trace', message: 'Parsing user input' }
{ timestamp: '2025-05-27T10:15:21.432Z', traceId: 'abc123', level: 'debug', message: 'Fetching products from DB' }
{ timestamp: '2025-05-27T10:15:21.765Z', traceId: 'jkl321', level: 'info', message: 'Received request for /checkout' }
{ timestamp: '2025-05-27T10:15:22.003Z', traceId: 'def456', level: 'error', message: 'Authentication failed', error: 'Invalid token' }
{ timestamp: '2025-05-27T10:15:22.789Z', traceId: 'jkl321', level: 'debug', message: 'Validating cart items' }
{ timestamp: '2025-05-27T10:15:23.123Z', traceId: 'ghi789', level: 'debug', message: 'Saving user input to session' }
{ timestamp: '2025-05-27T10:15:23.514Z', traceId: 'jkl321', level: 'error', message: 'Postgres connection reset', error: 'ECONNRESET' }
{ timestamp: '2025-05-27T10:15:23.456Z', traceId: 'abc123', level: 'trace', message: 'Products fetched successfully', data: [{ id: 1, name: 'Coffee Mug' }, { id: 2, name: 'Notebook' }] }
- Step 1: Get the
traceIdfrom the reported issue - Step 2: Search for the
traceIdin the logs
{ timestamp: '2025-05-27T10:15:21.765Z', traceId: 'jkl321', level: 'info', message: 'Received request for /checkout' }
{ timestamp: '2025-05-27T10:15:22.789Z', traceId: 'jkl321', level: 'debug', message: 'Validating cart items' }
{ timestamp: '2025-05-27T10:15:23.514Z', traceId: 'jkl321', level: 'error', message: 'Postgres connection reset', error: 'ECONNRESET' }
Boom! We have the logs for the request. What happened? We can see that the request came in, then it tried to validate the cart items, and then it got a connection reset error! Now we can see the complete picture.
Do you see why the traceId is important?
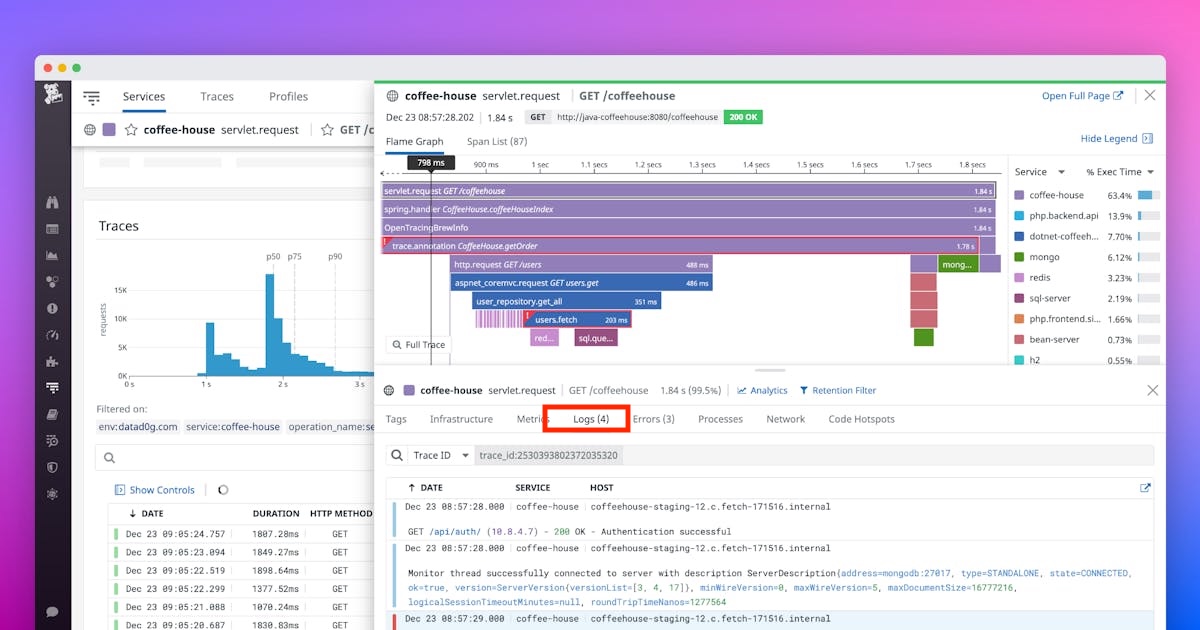
Usually, a good observability setup will show the logs along with traces in APM tools like Datadog. APM is a topic for another day! But I hope I’ve made my point clear about the traceId.
So, the logger we use should have seamless support for adding context like traceId, service name, etc., to the logs.
🔗Removing PII data from the logs
Leaking sensitive data in logs is a serious security vulnerability, categorized as “Security Logging and Monitoring Failures” (A09:2021 in the OWASP Top 10 2021).
const checkOut = (req, res) => {
    logger.info('User checkout info', request.body);
    // application logic...
}
If we log the request body, it will contain sensitive data like credit card number, CVV, and expiry date.
{ timestamp: '2025-05-27T12:00:00.001Z', traceId: 'mno789', level: 'info', message: 'Received request for /checkout' }
{ timestamp: '2025-05-27T12:00:00.234Z', traceId: 'mno789', level: 'debug', message: 'Validating payment details', data: { cardNumber: '4111 1111 1111 1111', cvv: '123', expiry: '12/26' } }
{ timestamp: '2025-05-27T12:00:00.567Z', traceId: 'mno789', level: 'info', message: 'Payment initiated for user user_456' }
As you can see, the credit card number is visible in the logs. If somebody gets access to these logs, they can see the sensitive data. To avoid this, we can remove the sensitive data from the logs by redacting them.
Most loggers have a feature called redact which can be used to redact sensitive data.
From Pino Logger’s official documentation:
To redact sensitive information, supply paths to keys that hold sensitive data using the redact option. Note that paths containing hyphens need to use brackets to access the hyphenated property:
const logger = require('.')({
  redact: ['key', 'path.to.key', 'stuff.thats[*].secret', 'path["with-hyphen"]']
})

logger.info({
  key: 'will be redacted',
  path: {
    to: {key: 'sensitive', another: 'thing'}
  },
  stuff: {
    thats: [
      {secret: 'will be redacted', logme: 'will be logged'},
      {secret: 'as will this', logme: 'as will this'}
    ]
  }
})
This will output:
{"level":30,"time":1527777350011,"pid":3186,"hostname":"Davids-MacBook-Pro-3.local","key":"[Redacted]","path":{"to":{"key":"[Redacted]","another":"thing"}},"stuff":{"thats":[{"secret":"[Redacted]","logme":"will be logged"},{"secret":"[Redacted]","logme":"as will this"}]}}
This way, we can redact sensitive data from the logs. In our case, we can redact the credit card number, CVV, and expiry date.
Note: Redaction can be performance-heavy, so use it wisely. There is a trade-off between security and performance, and there are many ways to redact logs — but that is out of scope for this article.
🔗Working well together with other tracing libraries
It’s not just about logging — it’s about having a solid observability setup. If our logger isn’t compatible with the tracing library we’re using, debugging becomes a pain. You might see a traceId in your logs and a different one in your APM tool, making them impossible to match.
So, we need to ensure that our logger is compatible with the tracing library we’re using.
For example, if we’re using the bunyan logger and dd-trace as our tracing library, we need to ensure that bunyan is compatible with dd-trace.
Pino logger has good support for OpenTracing. We can use OpenTracing for distributed tracing and Pino for logging. We can use open-source tools like Jaeger for tracing and any choice of logging system. We can use the traceId to match the logs and traces in the APM tool.
🔗Conclusion
I hope this article has helped you understand the importance of logging in Node.js. If you have any questions, feel free to ask them in the comments below.